
TOKYO, Mar 11, 2020 - (ACN Newswire) - A group of consultants at Azabu Insights Inc., a strategic consulting company in Azabu Juban Tokyo, have been analyzing data to understand the correlation between air temperature and spread of the coronavirus (Covid-19).

1. Outbreak in Japanese Prefectures, Mapped Against Average Temperature Celsius
2. Total Infection Cases, Countries with more than ten Covid-19 cases (excl. China)
3. Total Infection Cases, Countries with more than ten Covid-19 cases (incl. China)

4. Percentage of Top 51 Countries with Outbreaks
5. Percentage Case Increases by Selected Region
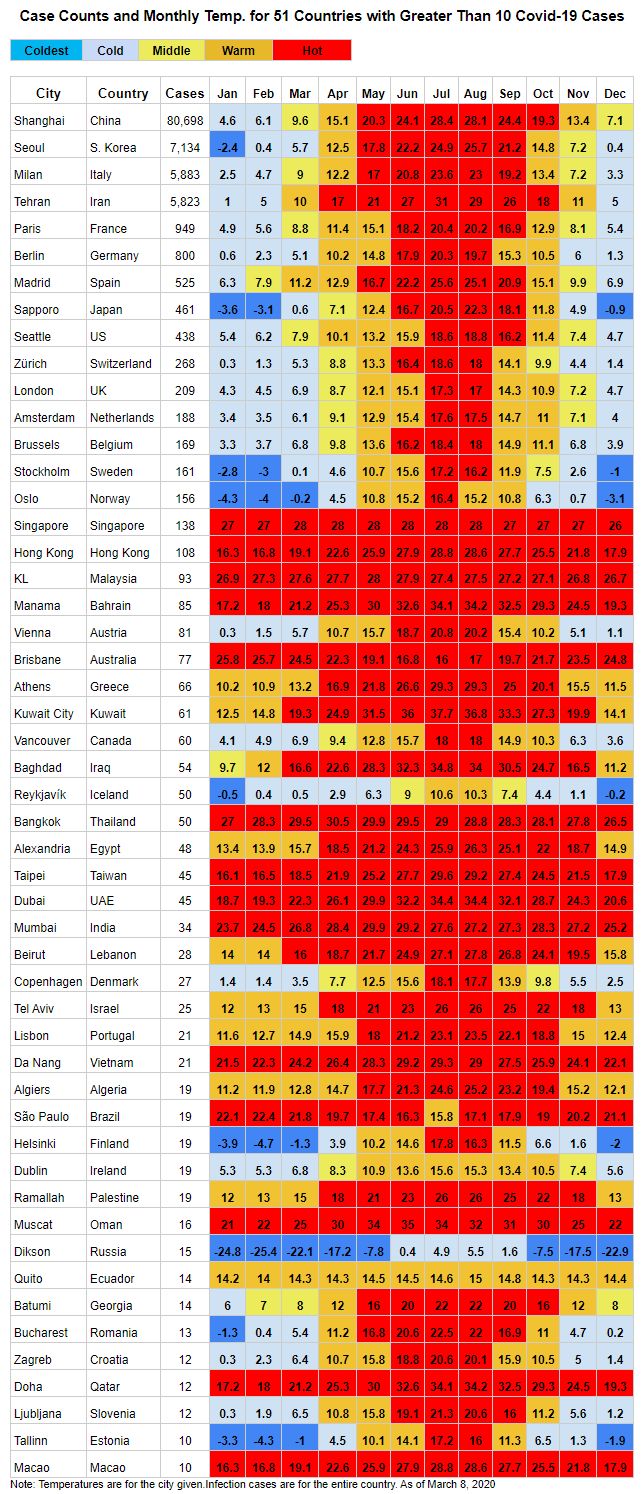
6. Case Counts and Monthly Temperatures, 51 Countries with more than ten Covid-19 cases
Last week we made the case that coronavirus seems to be spreading more in colder countries than in warmer countries and that there might be some respite for the Northern Hemisphere countries if we can make it to the warmer part of spring without numbers jumping up too aggressively.
This weekend we analyzed more data, more carefully, in two geographic models. First, we analyzed the number of cases in each of Japan's forty-seven prefectures (akin to States in the US). Second, we looked at countries and their mean monthly temperatures. Lastly, we looked at velocity of growth.
Japan Cases Overrepresented in Colder Prefectures
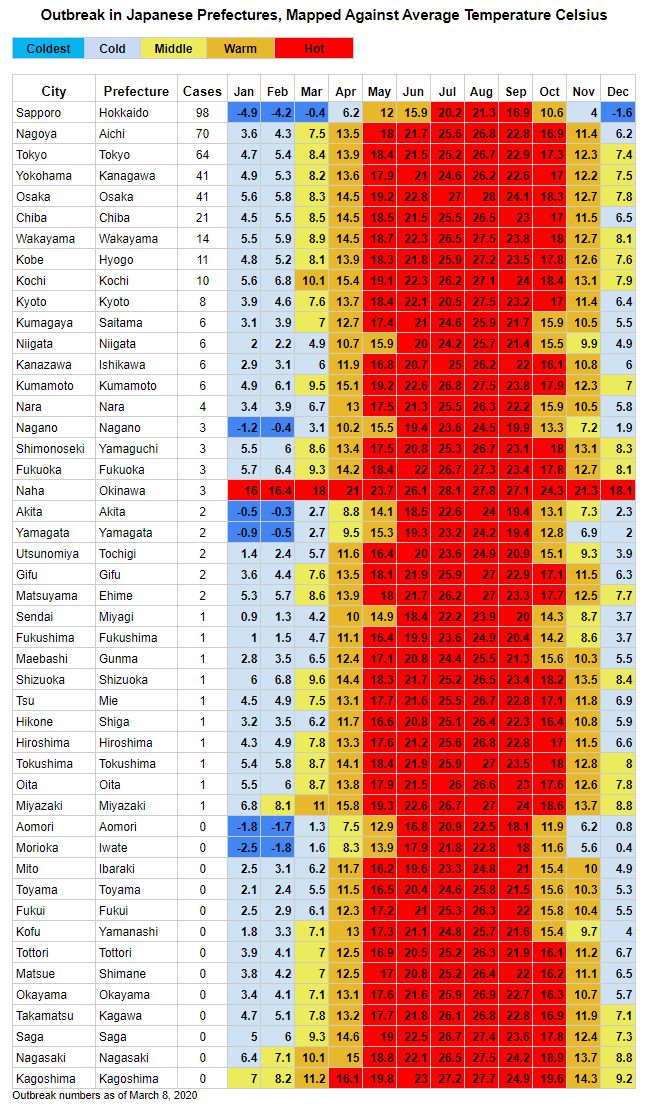
Japan is interesting to look at. Despite having only 126 million people living in 377,900 square kilometers (about the size of Montana), it spreads North and South from latitudes in line with Maine and Florida. The temperature dispersion is, not surprisingly, significant. Okinawa, which has about the same latitude as Miami, Florida, had an average February temperature of 16 degrees celsius (61 fahrenheit), whereas Sapporo, which has a latitude similar to Portland, Maine, had an average temperature of minus 4.2 degree celsius (24.4 fahrenheit).
In the below chart we included all of the prefectures of Japan, sorting them with the most Coronavirus infections at the top and going all the way down to zero infections at the bottom. An analysis of the prefectures below shows a number of interesting insights. First off we see that all of the areas with significant infection counts are considered either cold or very cold in February. Okinawa, as mentioned, is a warmer prefecture and had only three cases despite being one of the areas with many Chinese tourists.
We color coded the average temperatures across prefectures for every month of the year (the average of low and high temperature) into five categories, as below. The next insight is that most of the prefectures will need to wait until April or May to reach the February temperatures of Okinawa; temperatures will remain high through October.
1. Outbreak in Japanese Prefectures, Mapped Against Average Temperature Celsius
http://www.acnnewswire.com/topimg/Low_Azabu20200310-1.jpg
International Outbreak vs Temperature: 94-98% of Cases in Cold Regions
We next analyzed the international outbreak vs. temperature. Again, some interesting insights come through. First off we noticed that fourteen of the top fifteen countries were all "very cold" or "cold" in February. One country, Spain, was classified as "middle" temperature; it has the seventh most cases (as of March 8, 2020). Spain had an average temperature of eight degrees in February which, while certainly not hot, was somewhat warmer than the average of three degrees across the top fifteen countries.
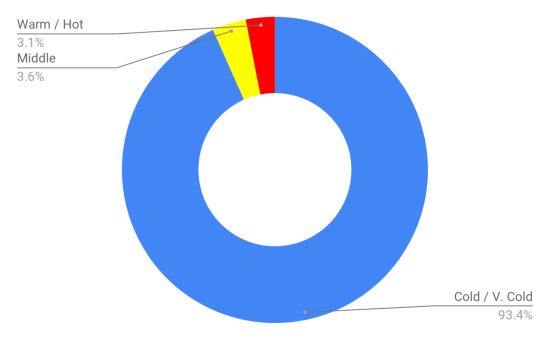
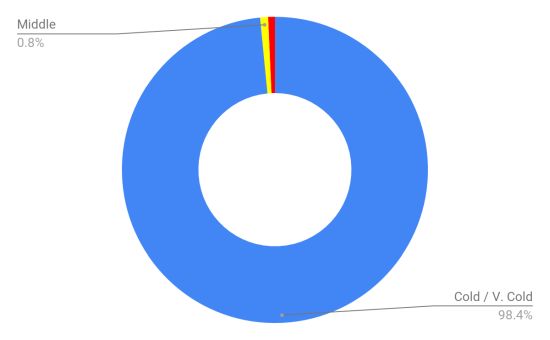
Further, we noted that there are currently fifty-one countries with at least ten cases. Of the total number of cases 22,967 or roughly 93 percent were in "cold" or "very cold" regions, excluding China. This number would be 103,655 or roughly 98 percent of cases including China. There were 880 cases in warm and middle regions and 753 in hot regions.
2. Total Infection Cases, Countries with greater than ten Covid-19 cases (excl. China)
http://www.acnnewswire.com/topimg/Low_Azabu20200310-2.jpg
3. Total Infection Cases, Countries with greater than ten Covid-19 cases (incl. China)
http://www.acnnewswire.com/topimg/Low_Azabu20200310-3.jpg
Looking at it on a country basis, just over half of the top fifty-one countries were in cold or very cold regions. Again, we caution not to read too much into this, since the aggregate numbers are skewed so high to cold regions. Cases do exist in many warm countries, but there are less of them and they seem to be spreading less quickly.
Further drilling down we see that Singapore and Hong Kong had 138 and 108 cases respectively, a large number amongst hot countries. These countries have a huge number of Chinese visitors but had surprisingly low outbreak rates. They are also interesting because they are very much "indoor" cities, where many people spend their time in large air conditioned buildings and indoor pedestrian walkways and shopping malls. From our discussions with people in Hong Kong and Singapore and from media reports we know that both cities have worked very aggressively to combat the outbreak. It is unclear whether their success is due to their hard work in combating it or due the temperature support or a combination.
4. Percentage of Top 51 Countries with Outbreaks
http://www.acnnewswire.com/topimg/Low_Azabu20200310-4.jpg
Upcoming Winter in the Southern Hemisphere
One concern that we identified was, as the northern hemisphere warms in May and June, that the Southern Hemisphere would be entering their colder winter months and, as such, potentially see an increase in outbreaks and the speed of spread of coronavirus.
On closer examination however we see that Southern Hemisphere winters are milder than many places in the Northern Hemisphere. For example, Hobart is Australia's coldest city and has an average temperature of 8.2 degrees celsius in July which would be classified as "middle" temperature. Similarly Bloemfontein in South Africa (7.2 degrees) and Santiago in Chile (8.2 degrees) are mild. Note, some smaller cities in the Southern and mountainous areas of South America, have colder temperatures, such as Punta Arenas in Chile with a July temperature of 1.5 degrees.
Overall we are hopeful that the milder Southern Hemisphere winters will result in slower spread and less outbreaks through the middle of 2020.
Long Summers in Many Countries
We see that many countries are clustered closer to the equator. This includes South East Asia, much of South Asia, the Middle East, the majority of Africa and much of South and Central america. Of the 51 countries where we have seen at least 10 cases, 23 of them have 6 months or more classified as "hot", with 13 of these countries "hot" all year round. Following the assertion that coronavirus spread is slower in hotter environments, this high number of hot months bodes well for a slowing of the spread of the virus over the ensuing months.
Conversely, we hold concerns for countries with very short summer seasons, particularly in Northern Europe. Global financial center London in the UK for example, only has 2 hot months for the year as does Amsterdam in the Netherlands. While Russia may see less inflow and outflow of people than London it is an outlier with every month of the year either cold or very cold. The potential for outbreaks and continued spread in these countries remains and should be continue to be monitored closely.
Velocity of Spread
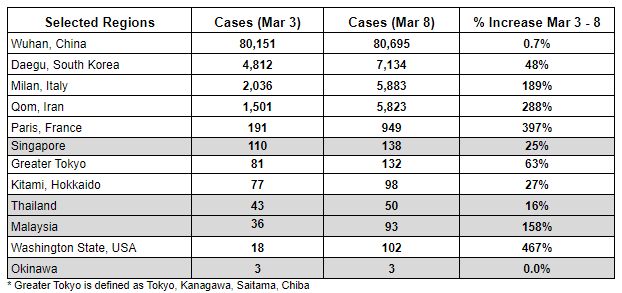
A final insight from the data comes from an analysis of the velocity of growth in warm versus cold regions. We found, when analyzing the ten regions we had previously looked at, that the rate of growth of the cases between March 3 and March 8th was faster in the colder regions (average growth of 185%) than in the warmer regions (average growth of 50%). This is to say, while Singapore had a fair number of cases early, their growth from March 3rd to 8th has been slow (only 25%). Cases for countries, such as Washington State (467%) France (397%), Iran (288%), and Italy (189%) all grew very quickly, during the same period. Amongst warm regions we had reviewed, one concern was Malaysia, which had cases jump 158%.
5. Increase in cases by region
http://www.acnnewswire.com/topimg/Low_Azabu20200310-5.jpg
Within Japan we also looked at velocity and found a major jump in Japan's second largest city, Osaka. Osaka is another cold populous city (8.8 million people) with lots of train travel and public gatherings. Numbers jumped to fifty-five cases from eight cases, a growth of 412%. Local media is reporting that this is connected to a cluster around live music events. Japan has also faced a shortage of masks in the past week, with many convenience stores receiving shipments of only two or three masks at a time. Rough counts on the street seem to show less people wearing masks than a week ago, when they were more available.
Osaka is Japan's second largest city and is home to a number of very famous listed companies, which may be further affected by the outbreak. These include: Takashimaya (TSE1: 8233), Capcom (TSE1: 9697), Teijin (TSE1: 3401), Panasonic (TSE1: 6752), Daikin Industries (TSE1: 6367).
Refer to the table below to view the cases and average temperatures in the fifty-one countries with ten or more cases. Looking at the pattern of temperature rise across the most affected countries, we see that most will need to wait at least until April or May (and some as late as June) to be classified as "warm" or "hot". There is then a respite until about October when temperatures will drop and be very supportive of the virus spread again.
6. Case Counts and Monthly Temperatures for 51 Countries with greater than ten Covid-19 cases
http://www.acnnewswire.com/topimg/Low_Azabu20200310-6.jpg
Conclusions
As with our previous article, we conclude that Covid-19 can spread in warm regions but seems to spread much more quickly in colder regions. We hope that countries and regions around the world will aggressively work to keep the virus at bay until the summer months and hope that the warm temperatures will support further containment.
Comments on our analysis are welcome at the email below.
About Azabu Insights
Azabu Insights is a boutique strategic consulting company based in Azabu Juban, Tokyo, Japan. Our teams work collaboratively with clients to build strategies that lead to positive change. Our multilingual team members have top tier academic backgrounds and deep industry experience that we leverage to provide first class, fully engaged, strategic consulting. Core specializations include life sciences, finance, electronics, automotive, aerospace and other industries. For more information contact: info@azabuinsights.com.
Copyright 2020 ACN Newswire. All rights reserved. www.acnnewswire.com